
Page 9 - GALENIKA MEDICAL JOURNAL
P. 9
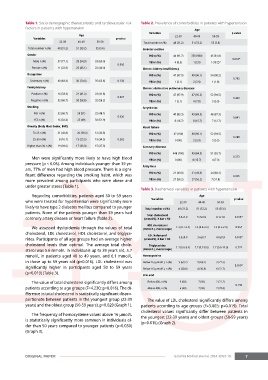
Table 1. Socio-demographic characteristics and cardiovascular risk   Table 2. Prevalence of comorbidities in patients with hypertension
            factors in patients with hypertension                                      Age
                                                                   Variables                            p value
                                    Age                                        22-39   40-49   50-59
                Variables                            p value
                           22-39    40-49   50-59                Total number n (%)  48 (31.2)  51 (33.2)  55 (3.6)
              Total number n (%)  48 (31.2)  51 (33.2)  55 (3.6)  Diabetes mellitus
             Gender                                                NO n (%)   44 (91.7)  350 (980)  45 (81.8)
                                                                                                        0.018*
                Male n (%)  37 (77.1)  28 (54.9)  33 (60.0)        YES n (%)   4 (8.3)  1 (2.0)  1 (18.2)*
                                                     0.005
               Female n (%)  11 (22.9)  23 (45.1)  22 (40.0)    Chronic kidney insufficiency
             Occupation                                            NO n (%)   47 (97.9)  49 (96.1)  54 (98.2)
                                                                                                         0.765
              Sedentary n (%)  40 (83.3)  36 (70.6)  35 (63.6)  0.132  YES n (%)  1 (2.1)  2 (3.9)  1 (1.8)
             Family history                                     Chronic obstructive pulmonary dissease
               Positive n (%)  16 (33.3)  21 (41.2)  23 (41.8)     NO n (%)   47 (97.9)  47 (92.2)  52 (94.5)
                                                     0.627                                               0.432
               Negative n (%)  32 (66.7)  30 (58.8)  32 (58.2)     YES n (%)   1 (2.1)  4 (7.8)  3 (5.9)
             Smoking                                            Arrythmias
                NO  n (%)  32 (66.7)  26 (51)  22 (48.1)           NO n (%)   40 (83.3)  43 (84.3)  48 (87.3)
                                                     0.026                                               0.841
                YES n (%)  16 (33.3)  25 (49)  33 (51.9)           YES n (%)    8 (16.7)    8 (15.7)    7 (12.7)
             Obesity (Body Mass Index, BMI)                     Heart failure
                To 25 n (%)  21 (43.8)     20 (39.2)  12 (32.8)    NO n (%)   47 (100)  49 (96.1)  52 (94.5)
                                                                                                         0.288
                25-30 n (%)    8 (16.7)  13 (25.5)  19 (34.5)  0.362  YES n (%)  0 (00)  2 (3.9)  3 (5.5)
             Higher than 30 n (%)  19 (39.6)  17 (33.3)  15 (27.3)  Coronary dissease
                                                                   NO n (%)   448 (100)  43 (84.3)  51 (92.7)
               Men were significantly more likely to have high blood   YES n (%)  0 (00)  8 (15.7)  4 (7.3)  0.213
            pressure (p < 0.05). Among individuals younger than 39 ye-
            ars, 77% of men had high blood pressure. There is a signi-  Fatty liver
            ficant  difference  regarding  the  smoking  habit,  which  was   NO n (%)  21 (43.8)  21 (43.8)  24 (68.2)  0.925
            more  prevalent  among  participants  who  were  obese  and   YES n (%)  27 (56.2)  27 (56.2)  7 (31.8)
            under greater stress (Table 1).
                                                                Table 3. Biochemical variables in patients with hypertension
               Regarding comorbidities, patients aged 50 to 59 years                      Age
            who were treated for hypertension were significantly more   Variables  22-39  40-49  50-59   p value
            likely to have type 2 diabetes mellitus compared to younger   Total number n (%)  48 (31.2)  51 (33.2)  55 (35.6)
            patients. None of the patients younger than 39 years had
                                                                  Total cholesterol
            coronary artery disease or heart failure (Table 2).  (mmol/L), X bar ± SD  5.6±1.0  5.7±0.9  6.1±1.0  0.016*
                                                                  HDL cholesterol
               We  assessed  dyslipidemia  through  the  values  of  total   (mmol/L), med (range)  1.3 (0.7-2.4)  1.2 (0.8-2.2)  1.2 (0.5-2.9)  0.964
            cholesterol, LDL cholesterol, HDL cholesterol, and triglyce-  LDL holesterol
            rides. Participants of all age groups had on average higher   (mmol/L), X bar ± SD  3.5±0.9  3.6±0.7  4.0±0.9  0.019*
            cholesterol  levels  than  optimal.  The  average  total  chole-  Тriglycerides
            sterol was 5.6 mmol/L in individuals up to 39 years old, 5.7   (mmol/L), med (range)  1.7 (0.6-3.4)  1.7 (0.7-8.0)  1.7 (0.6-14.0)  0.774
            mmol/L  in  patients  aged  40  to  49  years,  and  6.1  mmol/L   Homocysteine
            in those up to 59 years old (p=0.016). LDL cholesterol was   Below 16 (μmol/L), n (%)  9 (69.2)  9 (69.2)  3 (27.3)
            significantly  higher  in  participants  aged  50  to  59  years   Below 16 (μmol/L), n (%)  4 (30.8)  4 (30.8)  8 (72.7)  0.030*
            (p=0.019) (Table 3).
                                                                Uric acid
               The value of total cholesterol significantly differs among   Below 400, n (%)  9 (60)  7 (50)  2 (22.2)
            patients according to age groups (F=4.230; p=0.016). The di-  Above 400, n (%)  6 (40)  7 (50)  7 (78.8)  0.194
            fference in total cholesterol is statistically significant dispro-
            portionate between patients in the youngest group (22-39   The value of LDL cholesterol significantly differs among
            years) and the oldest group (50-59 years), p=0.020 (Graph 1).  patients according to age groups (F=3.065; p=0.019). Total
                                                                cholesterol  values  significantly  differ  between  patients  in
               The frequency of homocysteine values above 16 μmol/L
            is statistically significantly more common in individuals ol-  the youngest (22-39 years) and oldest groups (50-59 years)
                                                                (p=0.016) (Graph 2).
            der than 50 years compared to younger patients (p=0.030)
            (Graph 3).


            ORIGINAL PAPER                                                    Galenika Medical Journal, 2024; 3(9):5-10.  7